Plastic Pollution
A global overview from Our World in Data
These slides provide a global overview of plastics production, waste, and pollution of our oceans.They are designed to provide a summary of the plastics challenge and what this tells us about how to address it.
A more detailed exploration of this topic can be found at our topic page on Plastic Pollution
Outline
- How much plastic does the world produce?
- What is the fate of our plastics?
- How much plastic waste do we produce & how much ends up in the ocean?
- Where does plastic waste come from?
- How much plastic waste is traded?
- How do we tackle plastic pollution?
Annual global production of plastics has increased more than 200-fold since 1950.
In 2019 the world produced more than 450 million tonnes of plastic.
By 2019 cumulative plastic production was around 9.5 billion tonnes.
This is equivalent to more than one tonne of plastic for every person alive today.
Outline
- How much plastic does the world produce?
- What is the fate of our plastics?
- How much plastic waste do we produce & how much ends up in the ocean?
- Where does plastic waste come from?
- How much plastic waste is traded?
- How do we tackle plastic pollution?
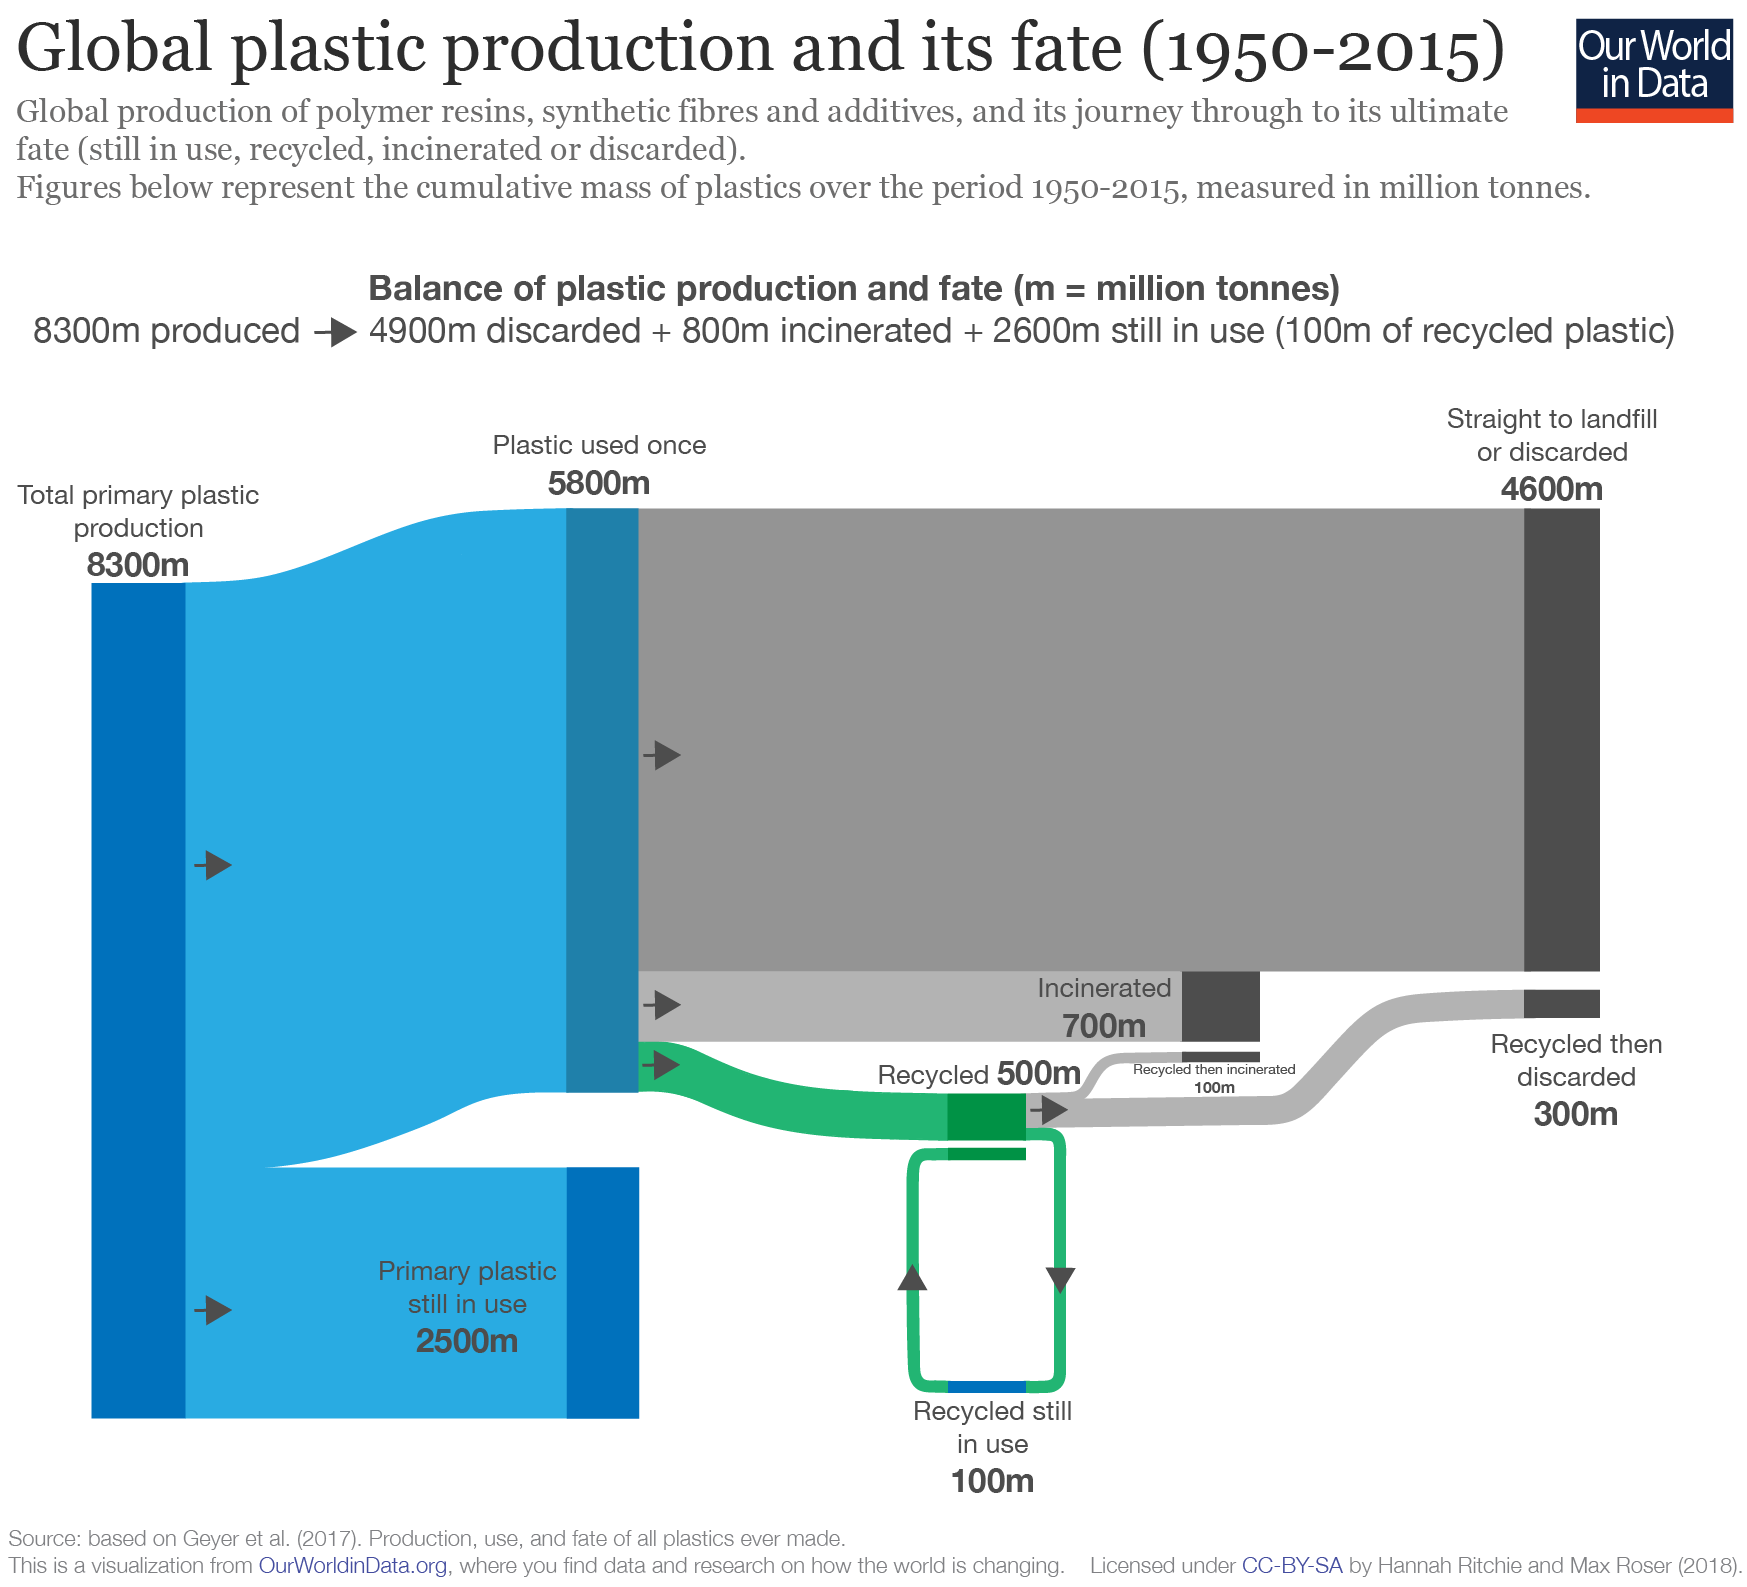
Of the global plastic produced over the period from 1950 to 2015:
Of 5.8 billion tonnes of plastic no longer in use, ~9% was recycled.
You can explore how the trend in global recycling, incineration and landfill has changed over time here.
This figure also highlights an important point about recycling.
Whilst recycling is preferable to incineration or landfill by displacing new plastic production, most plastic can be recycled only once or twice.
This means that most recycled plastic eventually ends up in landfill or incineration.
"Recycling delays, rather than avoids, final disposal"
(Geyer et al. 2017)
Outline
- How much plastic does the world produce?
- What is the fate of our plastics?
- How much plastic waste do we produce & how much ends up in the ocean?
- Where does plastic waste come from?
- How much plastic waste is traded?
- How do we tackle plastic pollution?

The world produces around 350 million tonnes of plastic waste each year.
Estimates vary, but studies suggest that 1 to 2 million tonnes enter the oceans annually.
That means 0.5% of plastic waste ends up in the ocean.
Outline
- How much plastic does the world produce?
- What is the fate of our plastics?
- How much plastic waste do we produce & how much ends up in the ocean?
- Where does plastic waste come from?
- How much plastic waste is traded?
- How do we tackle plastic pollution?
Where does plastic waste come from?
We can answer this in multiple ways:
- By sector
- By land-based and marine sources
- By country or region
Packaging is the largest contributor to plastic waste.
Packaging is the dominant form of waste because it:
Where does plastic waste come from?
We can answer this in multiple ways:
- By sector
- By land-based and marine sources
- By country or region

Plastic waste can arise from land (via coastlines and rivers) and from marine sources (such as fishing nets, ropes, lines and abandoned vessels).
How significant is each source for ocean plastics?
Best estimates suggest:
However, in certain locations, marine sources can be more significant. The Great Pacific Garbage Patch has more than half (52%) from marine sources due to intensive fishing activity in the Pacific Ocean.
Where does plastic waste come from?
We can answer this in multiple ways:
- By sector
- By land-based and marine sources
- By country or region
To identify the main geographical contributors to plastic pollution, we need to explore these figures in several steps:
- How much total plastic waste is generated by country
- How much plastic waste is generated by coastal populations - this is plastic which is most at risk of entering the ocean
- How much of coastal plastic waste is mismanaged (open, dumped or not enclosed) and can therefore enter waterways.
This interactive map shows the total plastic waste generation by country in 2010.
Per capita plastic waste generation can be explored here.
Here we see that the largest producers (China, USA, Brazil, Germany, Japan, Pakistan, Nigeria) span all continents.
But to understand the largest contributors to plastic pollution, we must correct for:
Mismanaged plastic waste is waste which is inadequately managed (seen in the chart opposite), plus littered waste (seen here).
High-income countries tend to have effective waste management systems and therefore low levels of inadequately managed waste.
Once we correct for these factors we can understand the geographical distribution of plastic waste at high risk of entering the ocean.
Each country's share of global mismanaged coastal waste is shown in the chart opposite.
Here we see very strong regional dominance particularly across Asia.
When we aggregate by region we see the majority of plastic at risk of entering the ocean arises from Asia and Africa, with the Americas playing a notable role.
Outline
- How much plastic does the world produce?
- What is the fate of our plastics?
- How much plastic waste do we produce & how much ends up in the ocean?
- Where does plastic waste come from?
- How much plastic waste is traded?
- How do we tackle plastic pollution?
Global trade of plastics has changed a lot in the last few years.
Historically, China has been the largest plastic importer. But in 2017, it banned imports of non-industrial plastic waste.
A number of other middle-income countries have done the same.
We can see this income group's share of global plastic imports has fallen dramatically
You can also see that the amount of plastic waste that rich countries export has fallen.
This is because middle-income countries are less willing to trade.
Outline
- How much plastic does the world produce?
- What is the fate of our plastics?
- How much plastic waste do we produce & how much ends up in the ocean?
- Where does plastic waste come from?
- How much plastic waste is traded?
- How do we tackle plastic pollution?
“If we all do a little, we’ll only achieve a little”
David MacKay (Sustainable Energy Without the Hot Air)
Most of our current approaches to tackling the problem of global plastic pollution focus on very small-impact solutions (e.g plastic straw bans).
These approaches, whilst well-intentioned, will be quickly absorbed by the growth of global plastics production.
We must focus on the high-impact solutions. Understanding the global picture of plastic pollution helps us to do this.
High-impact immediate priorities:
- Development of effective waste management infrastructure in all countries
- Cease plastic trade from rich to low or middle-income countries without sufficient investment in waste management infrastructure
- Strict legislation and management of fishing activity and waste
Development of effective waste management infrastructure in all countries
Most ocean plastic arises from countries with poor waste management infrastructure.
Development of effective waste management infrastructure in all countries should be a global priority.
Development of effective waste management infrastructure in all countries
If all countries had effective waste management, ocean plastics would fall dramatically.
Cease plastic trade from rich to low or middle-income countries
without sufficient investment in waste management infrastructure
The largest plastic exporters are some of the world's richest countries.
Trade to lower-income countriestransfers waste from well-managed to poorly-managed locations, increasing the risk of ocean pollution.
Rich countries should handle waste domestically & cease trade of plastic trade unless sufficient infrastructure is in place. A tax for exporting countries is one suggested method of raising funds for waste management services.
Strict legislation and management of fishing activity and waste
Marine plastics can be a major source of ocean pollution (most notably the Great Pacific Garbage Patch).
Most marine plastics arise from discarded nets, ropes, lines and vessels.
Fishing activity should be better-regulated and managed to limit these sources.
Longer-term shifts in consumption models
Longer-term innovations should aim to shift away from a linear make-use-(recycle)-dispose model.
To be effective, innovation needs to take account of:
Explore this topic in detail at our:
Main topic on Plastic Pollution
About the author:
Hannah Ritchie is a scientist at the University of Oxford.
She is a Researcher at the Oxford Martin Programme on Global Development.About Our World in Data:
Our World in Data is an online publication that shows how living conditions are changing. The aim is to give a global overview and to show changes over the very long run, so that we can see where we are coming from, where we are today, and what is possible for the future.
www.ourworldindata.org | @HannahRitchie02