Global education:A selection of key charts and trends
Part 1 of 7
Population growth and pressure on global education systems
Since 1950 the number of children aged 15 and under around the world increased rapidly, from 0.87 to 1.93 billion in 2015. As the population of children in school-age more than doubled the demand for education increased rapidly. (Note: You can explore trends by country using the option "Change country" in this interactive chart.)
But the global demography is changing rapidly. Until the mid-1960s the global total fertility rate was 5 children per woman. Since then the fertility rate has halved globally.
Across countries we see that fertility rates are high where women have little access to education. Women's access to education is a key driver of lower fertility rates. You can read our review of the empirical and theoretical literature behind this relationship here. (Note: In this interactive scatter plot you can click on the continent labels on the right to highlight specific regions. And you can use the option "Search", at the bottom, to highlight specific countries.
The link between fertility and education is prominent both across countries, and within countries over time.In this chart we see that as the education of women improved, fertility rates declined.

In countries where fertility rates are high today, we also see the same stong relationship between better education and lower fertility rates.In countries with high fertility rates the issue is that only a very small minority of women has access to higher education.
Fertility, in turn, is a key driver of population growth. As mentioned before, since 1950 the global number of children younger than 15 years of age increased rapidly. Yet with much lower fertility, the UN expects the number of children to peak in 2057 at 2.094 billion children and by the end of the century the number of children is projected to be at 1.97 billion, just the same as today. (Note: You can read more about this in our blog post "When will the world reach 'peak child'?")
The distribution of children will however change: This chart shows how the UN projections for the number of school-age-children break down by world regions. Asia had to provide for a population of under-15-year-olds that doubled in size in less than 50 years, but over the coming decades this population will decrease in size. In the future, Africa is projected to see a very large increase of school-age-children. Not quite as large as the increase in Asia, but still almost a doubling until the end of the century. How this will turn out however will depend substantially on how successfully women are given access to education on the African continent in the short run. On a global scale the challenges for education in the last century were very different from the challenges ahead.
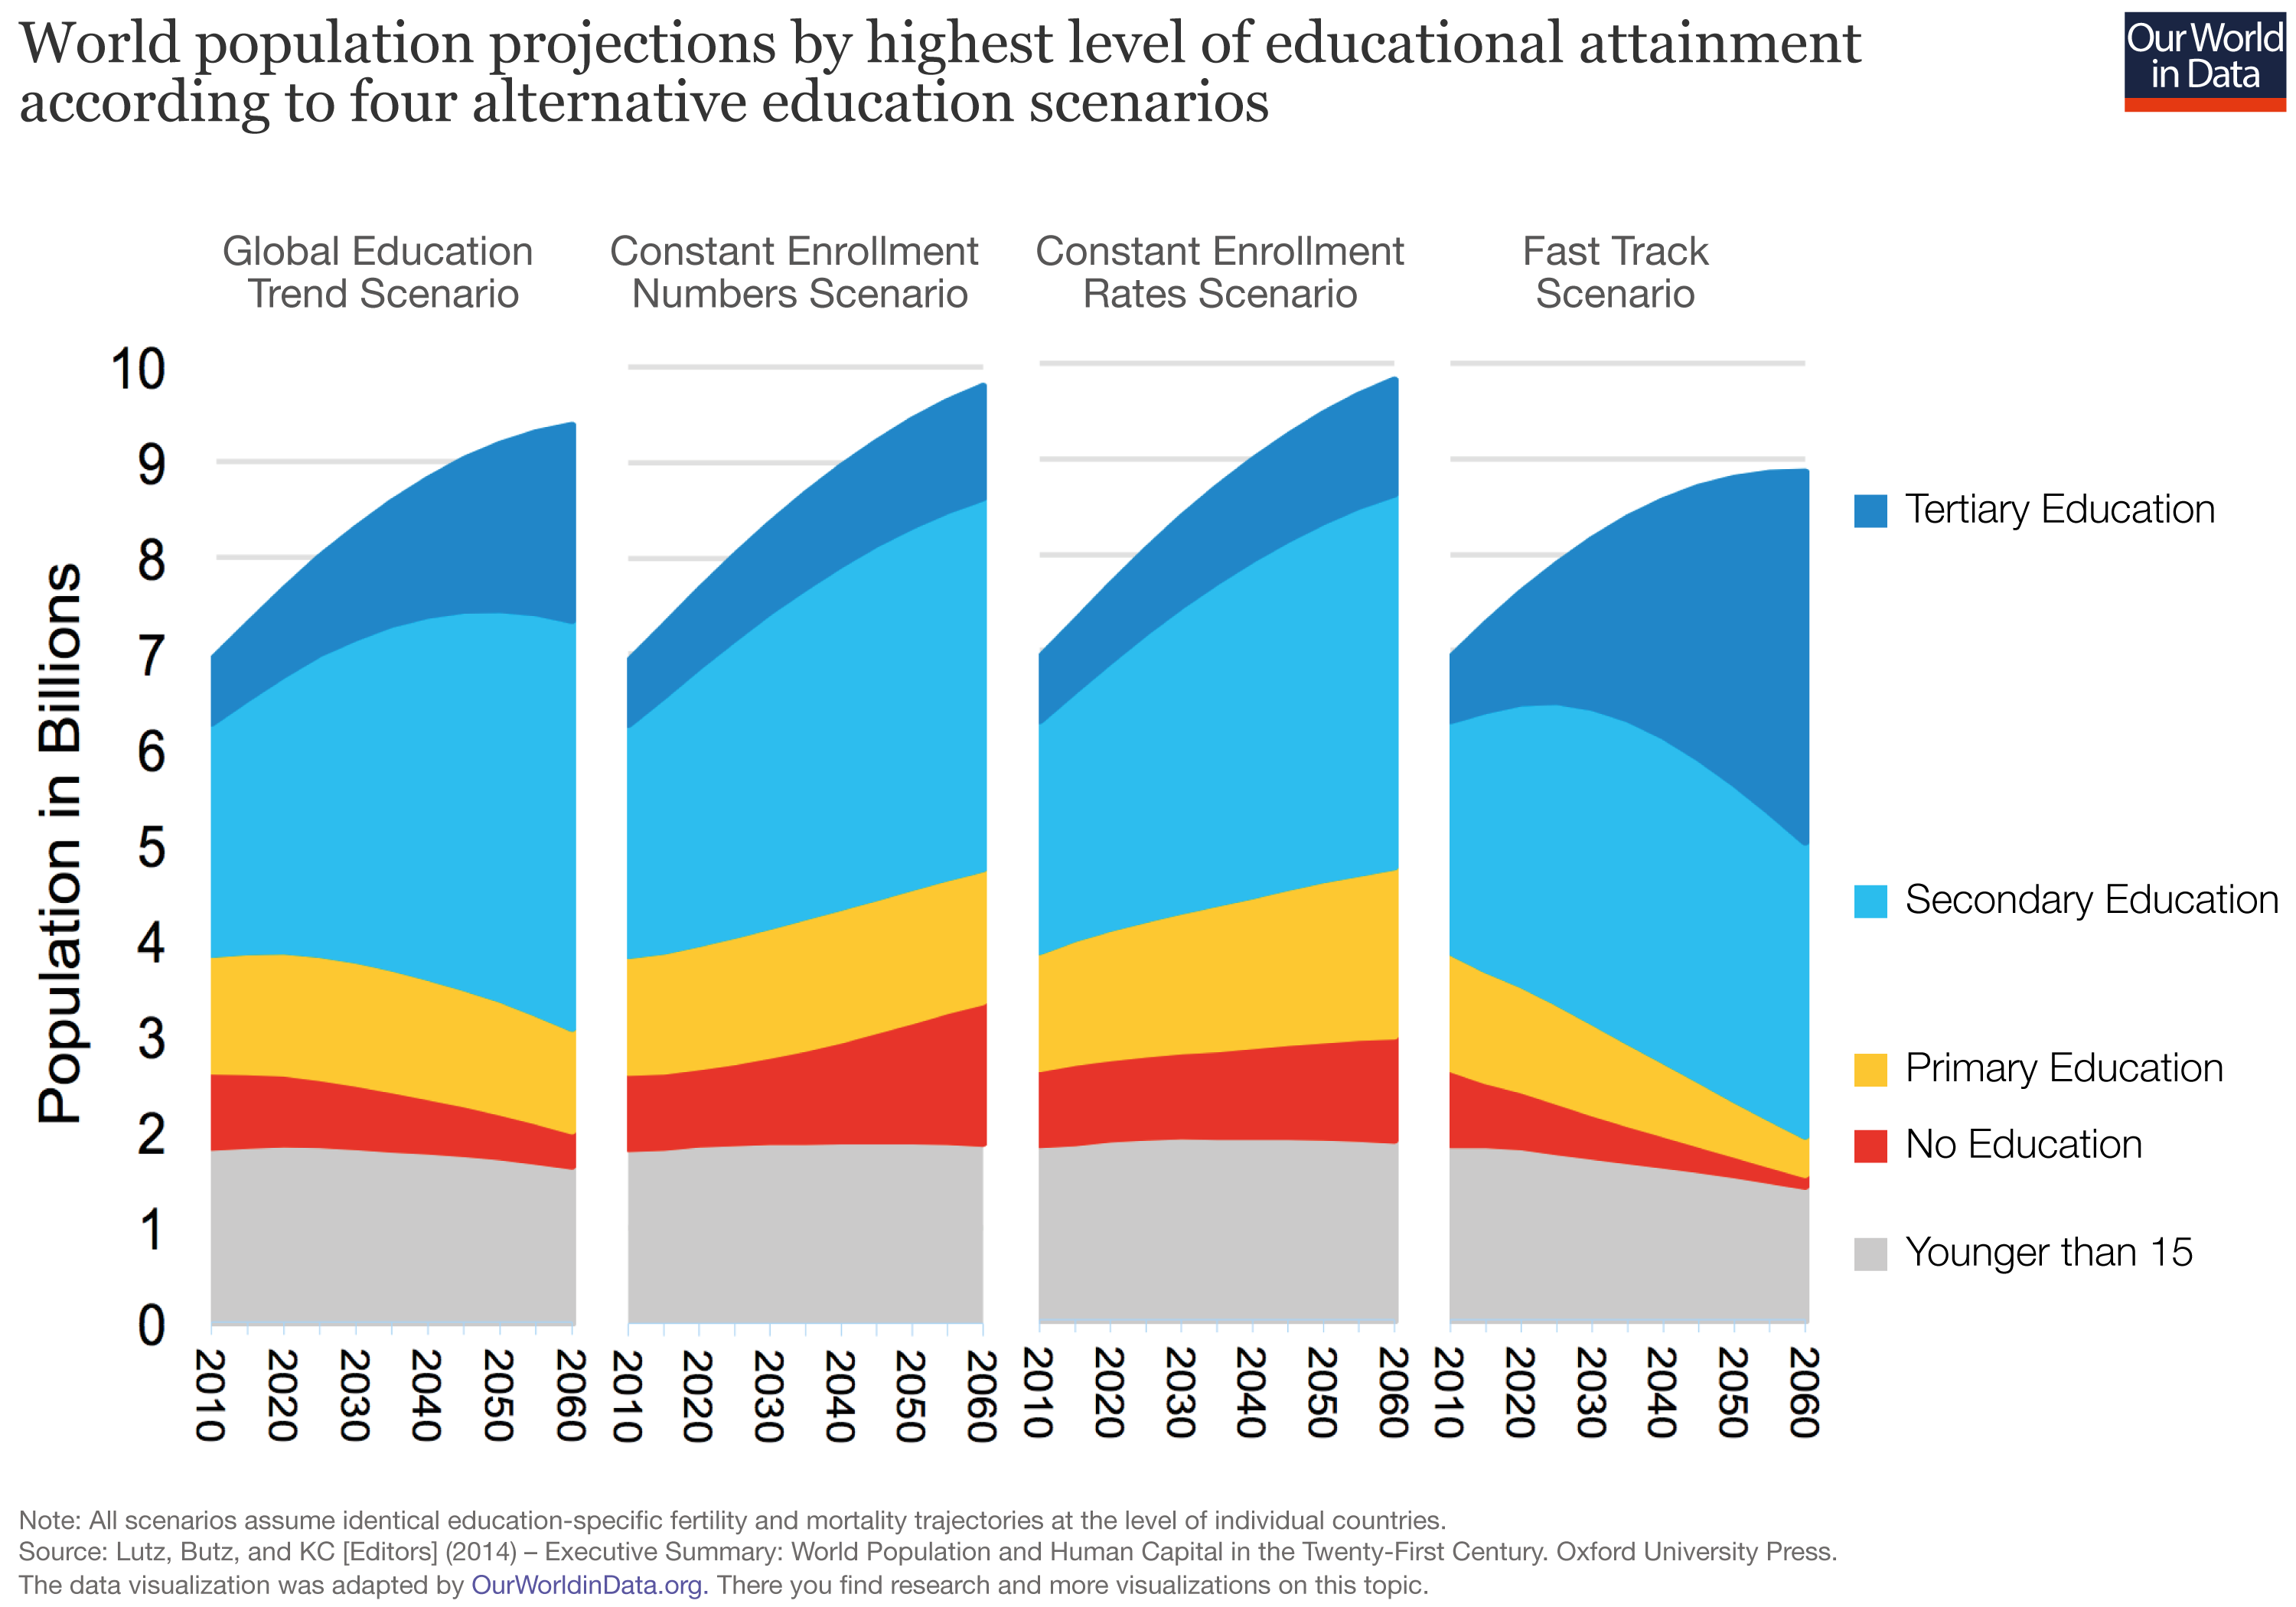
The demographers at IIASA are producing global demographic projections in which the various scenarios differ in how rapdily global education can be improved. As this visualization shows, the impact of different assumptions about education expansion are very large: The faster education can be made available, the faster the world will see a slow-down in population growth. Reasonable scenarios can make a difference of almost 1 billion people as early as 2060. All details can be found in the authors' publication in Science.
Africa is the continent where the UN and IIASA demographers differ most substantially. The UN projects a population of 4.5 billion in Africa in 2100 – see this visualization. The IIASA researchers, whose projection is shown here on the left, on the other hand project an end of rapid population growth in Africa by the end of the century when the population will reach 2.6 billion people. A difference of almost 2 billion people.
And equally the size of the school-age-population in Africa in the long-run will very much depend on how rapidly education to women can be expanded in the short run. A fast expansion of education is projected to lead to half the size of the under-15-year-old population as compared to a stagnation at the current enrollment rates.
Other resources from Our World in Data
- More slides from this series: ourworldindata.org/slides/Edu_Key_Charts/Menu/ToC.html
- Other articles and resources across related topics: – Fertility – Population Growth – What is hindering young people to reach their potential?